Debugging is a crucial software development technique that allows us to identify and fix problems before they spiral out of control. It is both an art and a science, with several rules and techniques that can be used to help us find problems in our code.
However, the debugging process can be tedious and time-consuming, especially when working on a large-scale project.

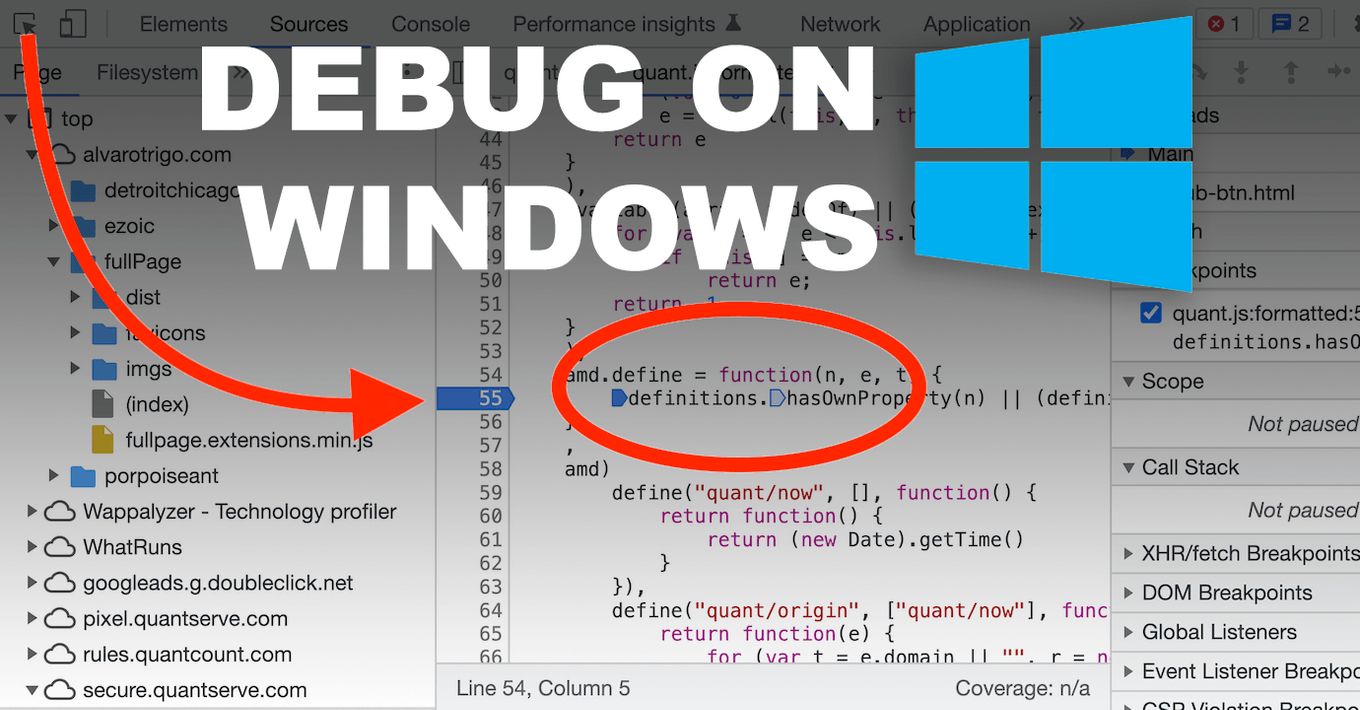
This post has compiled a list of the top debugging tools for windows out there right now and will help you keep your sanity during those long days of debugging.
What are Debugging Techniques?
Debugging techniques are the methods used by developers to find and isolate bugs in software or hardware. You can debug your code or use a debugger on another computer. Debugging is an essential part of software development.
Debugging techniques can be used in any program, from tiny embedded systems to large programs with thousands of lines of code.
What is a Debugging Tool?
A debugging tool is a software program that allows you to debug a program without recompiling it or changing its source code. Tools for debugging allow developers to attempt to fix a problem in a program without having to modify the code.
Programmers often use tools for debugging when they encounter a problem with their program or need to make adjustments before releasing their work. Tools for debugging can also be helpful for troubleshooting problems with other programs, such as operating systems and web browsers.
Top Debugging Tools for Windows
Debugging is one of the most challenging tasks to perform in the Windows operating system. And the process of debugging can be taken up a level by using some of the advanced utilities and tools for debugging that assist in developing efficiency and productivity in the workflows.
Here are the top-rated tools for debugging windows:
1. Microsoft Console Debugger Tool
The Microsoft Console Debugger is a program that allows you to see what your computer is doing at any time. It allows you to debug your code, step through it line by line, and even watch variables change over time as you run the program.
The great thing about the Console Debugger is that it doesn’t take up any memory on your computer, so it will always be there when you need it. The downside is that it can only be used with Visual C++ programs written in C++ Builder or Visual C++.
How to Install Console Debugger
Here’s the procedure to follow while installing the Console Debugger:
- From within Windows Explorer, navigate to C:WindowsSystem32dllcache.
- Right-click on dllcache and select ‘Properties’ from the resulting context menu.
- Click on the Security tab, then click Edit from the window’s lower-right corner. Make sure that ‘Allow file system access’ is selected.
- Click OK to save your changes and then close the dialog box.
- After that, restart your computer so that Windows can load all the required files into memory.
Features of Console Debugger
- The ability to debug native applications on Windows 10, 8, 7, Vista, and XP.
- Attach to any process on your system.
- Set breakpoints in your code and watch them execute step-by-step.
- View variables at runtime and step through each line of code in a process as it executes.
- Set conditional breakpoints that are only triggered when certain conditions are met (for example, when an error occurs).
2. WinDbg Preview Debugging Tool

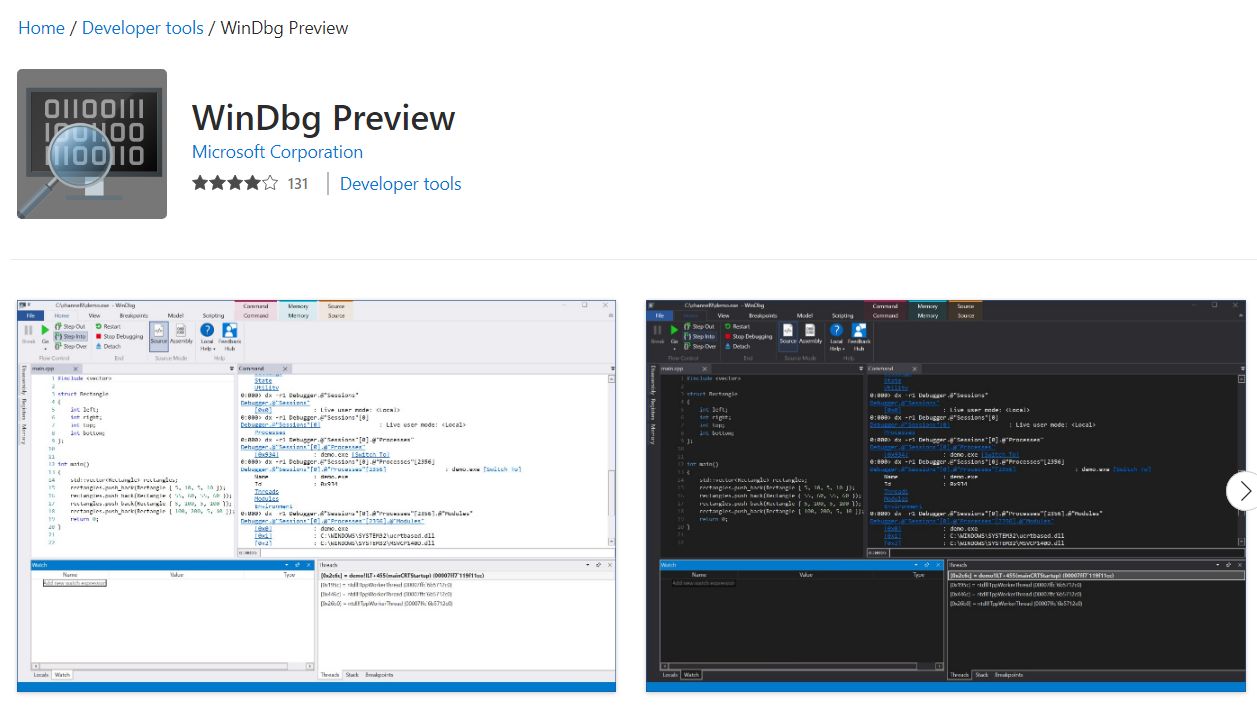
The WinDbg debugger is among the debugging tools for Windows. It allows you to analyze the state of running applications, including program data and memory state, breakpoints, watchpoints, and call stacks.
WinDbg can also show a human-readable view of the disassembly of any managed code in memory or saved to disk. This allows you to see how your application works at runtime.
Furthermore, WinDbg supports IDA Pro decompilation.
Features of WinDbg
This debugging tool for Windows comes with lots of features, including:
- Breakpoints: You can add breakpoints to your code to stop execution or examine values at specified locations.
- Watch: WinDbg will display changes in real-time if a variable is modified.
- Step Over: Step over the current line and continue executing it until it hits a breakpoint, then step over all subsequent lines until another breakpoint is hit.
- Step Into: Execute the following line after the current one until it hits a breakpoint, then step into other lines until another breakpoint is hit.
- Step Out: Execute all remaining lines after the current one until it hits a breakpoint, then exit from all other lines until another breakpoint is hit.
- Continue/Break/Continue All/Break All: Continue executing all remaining lines until another breakpoint or exception occurs. Break from execution if exceptions occur.
3. Fiddler

Fiddler is another open-source web debugging proxy that can intercept and modify HTTP connections between your computer and the internet. It’s distributed under the GNU General Public License.
Fiddler is an HTTP connection debugger and proxy tool that allows you to inspect requests and responses as they are sent over the network interface on your computer. You can also change or add headers to the request or response. Fiddler also allows you to modify the request while the browser is processing it.
Features of Fiddler
Fiddler includes features such as:
- Fiddler Proxy Server: This allows you to control all traffic in both directions at once.
- Debugging Proxy: You can view the request and response headers of any page that passes through Fiddler.
- HTTP Header Viewer: This allows you to view all fields in an HTTP header.
- Scripting API: Write scripts in JavaScript using a simple object model.
4. Visual Studio Debugger

The primary tool for debugging in Visual Studio is the debugger. You can use the debugger to step through your code line by line, set a breakpoint that will stop execution at a specific point in your code, and watch variables as they change.
You can also use this tool for debugging to set up data watches and see how your program’s variables change over time. For example, you might want to know whether a variable gets bigger or smaller over time or whether it gets larger or smaller concerning another variable.
The first thing you need to do is open Visual Studio and start a new project. Once your application is created, you can use its debugger to debug the code running in it.
How Do I Get to Windows Debugging Tools?
- Find the Start Button (lower-left corner of your screen), type “sdk” and click on Windows SDK (Debugging Tools) from the search results.
- Click on Debugging Tools For Windows. A new window will open to install Debugging Tools. You can either install all or only the core tools.
- Go to your start menu and find the shortcut to Debugging Tools for Windows, usually in C:Program FilesWindows Kits10Debuggersx64
Does Windows 10 Have Debug?
Windows 10 has a built-in debugger. It is called “Windows 10 Debugger” and is a separate tool from Visual Studio.
The purpose of the Windows 10 Debugger is to debug your application in real-time with the help of a mouse and keyboard. You can set breakpoints, run your program, inspect variables, and call APIs from within the debugger. You can even attach a debugger to an existing process using Process Explorer.
To use it, press F5 on Windows 10 or right-click on any executable file in File Explorer and choose Debug -> Attach to Process.
3 Tips to Avoid PC Bugs
PC bugs are widespread, and there are many things you can do to avoid them before looking for tools for debugging. Here are four tips that should keep you safe:
1. Get a Firewall
By installing a firewall on your computer, you’ll be able to prevent unauthorized access to your personal information, such as passwords and credit card numbers. You can also block unwanted programs, such as adware and spyware, from accessing your system.
2. Update Your Software Regularly
Updating your software is one of the most important things you can do to keep your PC safe. If you don’t update, you may find yourself vulnerable to malware and other security threats.
3. Avoid Suspicious Links
If someone sends you a link to download something, make sure that it is actually what it claims to be (or at least what it looks like). Some people try to trick users into downloading fake software that can cause harm to their computers or steal information from them.
Make sure the link leads to what appears to be an official website before clicking on anything else.
Conclusion
Debugging allows you to quickly find and correct errors in your code by implementing visual feedback on the screen. Then you can track the cause of the error and fix it, skipping some lines of unnecessary code. This article has reviewed some of the best tools for debugging Windows programs to ease your debugging process.
![13+ Best Database Software For Mac [Reviewed & Ranked] mac database software share](https://alvarotrigo.com/blog/wp-content/uploads/2023/08/mac-database-software-share-300x150.png)
![9+ Proven Best Photo Management Software [Mac & Windows] photo management software share](https://alvarotrigo.com/blog/wp-content/uploads/2023/08/photo-management-software-share-300x150.png)
![13 Unblocked Web Browsers [Access Blocked Sites!] unblocked-web-browsers](https://alvarotrigo.com/blog/wp-content/uploads/2025/01/unblocked-web-browsers-300x200.jpg)
![13+ Best Text Browsers [Reviewed & Ranked] text browsing share](https://alvarotrigo.com/blog/wp-content/uploads/2023/08/text-browsing-share-300x150.png)
![7 Best Alternative Web Browsers [To Chrome, Safari & Firefox] alternative web browsers share](https://alvarotrigo.com/blog/wp-content/uploads/2023/08/alternative-web-browsers-share-300x150.png)
![16 Best Chromium Browsers 2024 [Ranked & Reviewed] best chromium browsers share](https://alvarotrigo.com/blog/wp-content/uploads/2023/08/best-chromium-browsers-share-300x150.png)